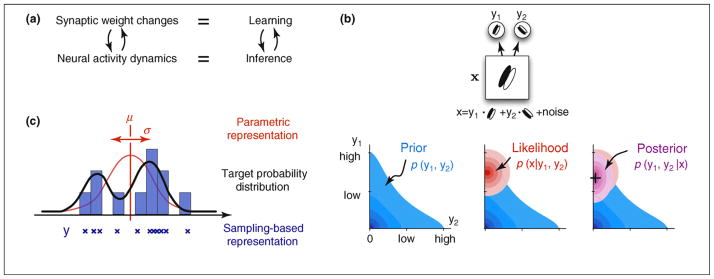
Figure 3.
Neural substrates of probabilistic inference and learning. (a) Functional mapping of learning and inference onto neural substrates in the cortex. (b) Probabilistic inference for natural images. (Top) A toy model of the early visual system (based on Ref. [43]). The internal model of the environment assumes that visual stimuli, x, are generated by the noisy linear superposition of two oriented features with activation levels, y1 and y2. The task of the visual system is to infer the activation levels, y1 and y2, of these features from seeing only their superposition, x. (Bottom left) The prior distribution over the activation of these features, y1 and y2, captures prior knowledge about how much they are typically (co-)activated in images experienced before. In this example, y1 and y2 are expected to be independent and sparse, which means that each feature appears rarely in visual scenes and independently of the other feature. (Bottom middle) The likelihood function represents the way the visual features are assumed to combine to form the visual input under our model of the environment. It is higher for feature combinations that are more likely to underlie the image we are seeing according to the equation on the top. (Bottom right) The goal of the visual system is to infer the posterior distribution over y1 and y2. By Bayes’ theorem, the posterior optimally combines the expectations from the prior with the evidence from the likelihood. Maximum a posteriori (MAP) estimate, used by some models [40,43,47], denoted by a + in the figure neglects uncertainty by using only the maximum value instead of the full distribution. (c) Simple demonstration of two probabilistic representational schemes. (Black curve) The probability distribution of variable y to be represented. (Red curve) Assumed distribution by the parametric representation. Only the two parameters of the distribution, the mean μ and variance σ are represented. (Blue “x”-s and bars) Samples and the histogram implied by the sampling-based representation.

