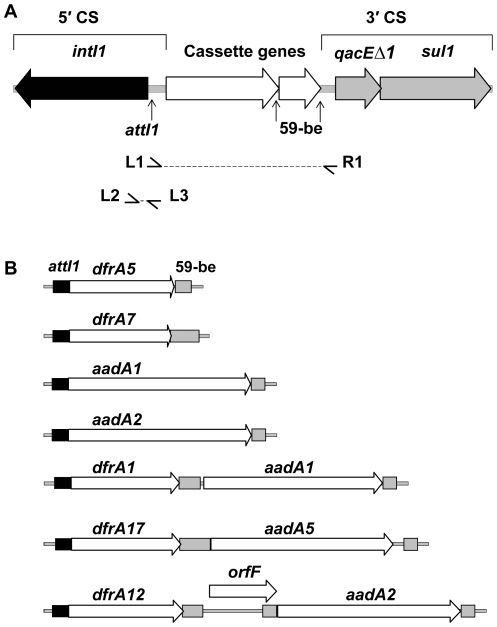
Figure 1. Features and characterization of typical class 1 integrons.
(A) Structure of a typical class 1 integron showing the 5′- and 3′-CS. The location and the direction of transcription of genes are indicated. The class 1 integrase gene intI1 (black arrow) and attI1 integron-integration site (vertical arrow) are located in the integron 5′-CS. The qacEΔ1 gene and the sul1 gene (grey arrows), and the open reading frame orf5 (not shown) are located in the 3′-CS. Inserted gene cassettes are represented by unfilled arrows and their associated 59-be are indicated by vertical arrows. L1, R1 and L2, L3 primer annealing sites are indicated by small horizontal arrows. (B) A diagram showing the genetic structure of the gene cassette arrays amplified using standard PCR primers that target the 5′- and 3′-CS of typical class 1 integrons (cassette arrays detected: dfrA5, dfrA7, aadA1, aadA2, dfrA1/aadA1, dfrA17/aadA5 and dfrA12/orfF/aadA2). The following features are indicated: attI1 recombination sites (black filled boxes), gene cassette arrays (unfilled arrows) and 59-bes (grey filled boxes). All diagrams are drawn to scale.

