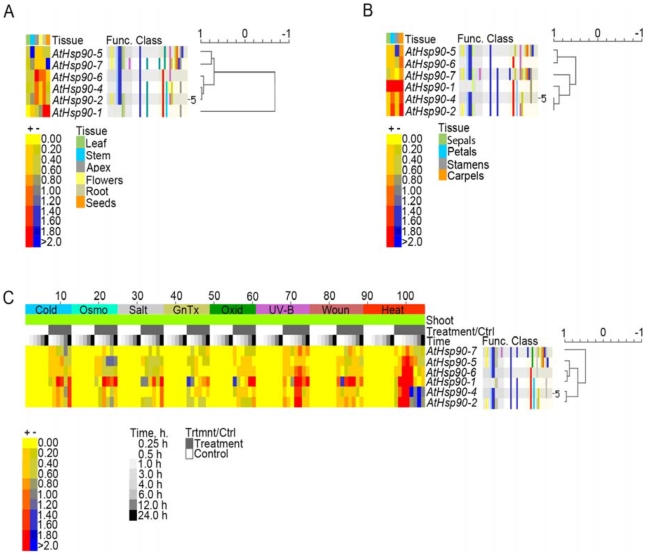
Figure 3. Expression profiles of AtHsp90 genes.
(A) e-Northern results for expression of AtHsp90 genes in root, stem (second internode), leaf (cauline leaves), apex (shoot apex; inflorescence), flowers (stage 12), and seeds (stage 10, without siliques). (B) e-Northern results for expression of AtHsp90 genes in individual floral organs (flowers stage 12), sepals, petals, stamens and carpels. (C) e-Northern results for expression of AtHsp90 genes in response to different abiotic stresses. The control is mock treatment at each time point. The colour scale indicates the log2-level of expression above or below the median. Dark red indicates more than 4-fold above the median, while dark blue indicates 4-fold below. The clustering tree can be seen to the right of the heatmap.

