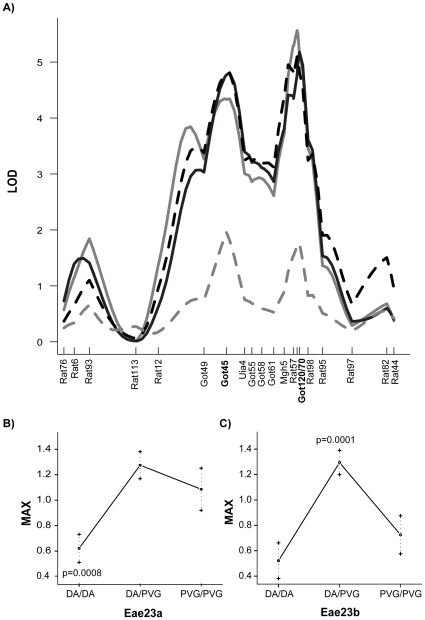
Figure 1. Two QTLs regulate EAE: Eae23a and Eae23b.
A) A log-likelihood plot of Eae23 regulating selected EAE phenotypes in (DAxPVG.1AV1)G10 AIL females (N = 428). Peak markers are D17Got45 for Eae23a and D17Got120 (ONS and DUR) and D17Got70 (INC, MAX and CUM) for Eae23b, and both QTLs displayed linkage to all clinical phenotypes. Microsatellite marker positions are indicated by vertical lines on the x-axis, retrieved from Ensembl Genome Database (http://www.ensembl.org v.55). B–C) Allelic effect plots for Eae23a and Eae23b in females (N = 428) show rats stratified according to their genotype at D17Got45 and D17Got70. MAX is representative for all clinical phenotypes. Phenotype codes: ONS = grey, MAX = black, DUR = black dashed, WL = grey dashed.

