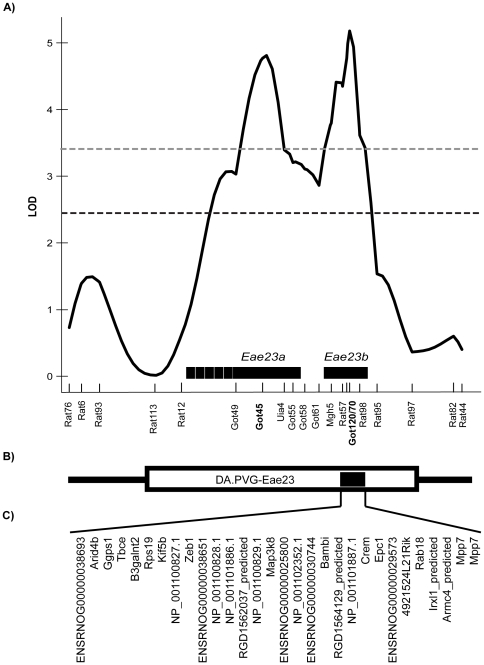
Figure 2. Summary of the Eae23 region on RNO17.
A) Summary log-likelihood plot of Eae23. The black dashed line depicts the significance threshold determined by the analysis of residual family values and the grey dashed line depicts a threshold of 3.4 [30]. Horizontal bars above the x-axis indicate the confidence intervals of each QTL according to a 1.5 LOD support interval (clinical phenotypes are represented by MAX). Microsatellite marker positions are indicated by vertical lines on the x-axis, retrieved from Ensembl Genome Database (http://www.ensembl.org v.55). B) The open box below the x-axis represents the region where PVG alleles were introgressed into a DA background in the DA.PVG-Eae23 congenic strain tested in MOG-EAE. The black box indicates the confidence interval of Eae23b. C) The candidate genes investigated in this study: 30 genes contained within Eae23b.

