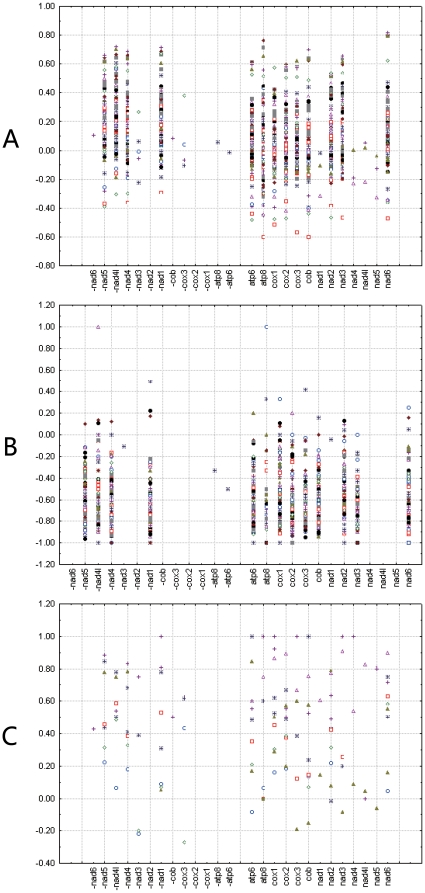
Figure 4. Scatterplots of skews values calculated for third codon positions of individual protein-coding genes.
(A) Relationship of AT skew on third codon position of individual gene and gene direction in 120 insect species. (B) Relationship of GC skew on individual gene and gene direction in 110 insect mitochondrial genomes with normal replication origin. (C) Relationship of GC skew on individual gene and gene direction in 10 insect mitochondrial genomes with inverted replication origin. Gene name with minus indicates that the gene is encoded on minority strand, while without minus indicates on majority strand.

