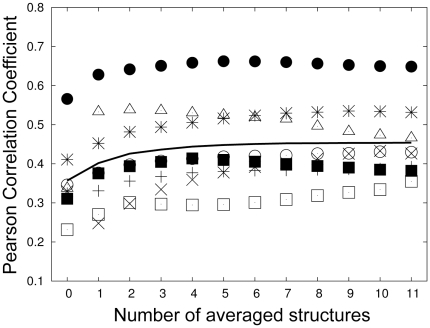
Figure 2. Performance Dependency on Number of Averaged Energies.
Out of 11 conformations sampled via molecular dynamics simulation, the average energy of n lowest energies was used as the binding energy. At n = 0, the average performance when a single conformation was used for calculation is plotted. ‘+’: ABP1, ‘×’: Amphyphisin, ‘*’: Endophilin, empty box: MYO5, filled box: RVS167, empty circle: SHO1, filled circle: LSB3, triangle: YSC84, line: averaged performance.

