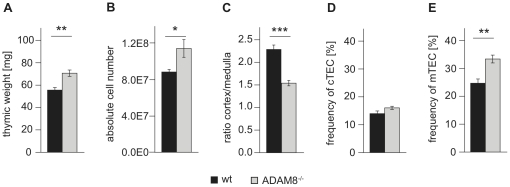
Figure 2. ADAM8−/− thymi have an increased mass and a reduced cortex/medulla ratio associated with a relative increase in mTEC.
(A) Weight and (B) total numbers of thymocytes thymi from age- and gender-matched wt and ADAM−/− mice (n = 8). (C) Cortex/medulla ratios examined on Hematoxylin/Eosin stained 20 µm sections of wt and ADAM8−/− thymi (each 6 sections of 6 wt or ADAM−/− thymi). Frequencies of (D) cTEC (Ly51hi, UEA-1lo) and (E) mTEC (Ly51lo, UEA-1hi) in CD45−, EpCAM+ thymic epithelial fraction of thymic suspensions obtained by collagenase/dispase treatment. Data are representative of two independent experiments with at least four mice per group. Data are presented as mean values and error bars as SEM. *, p<0.05, **, p<0.01, *** p<0.001.

