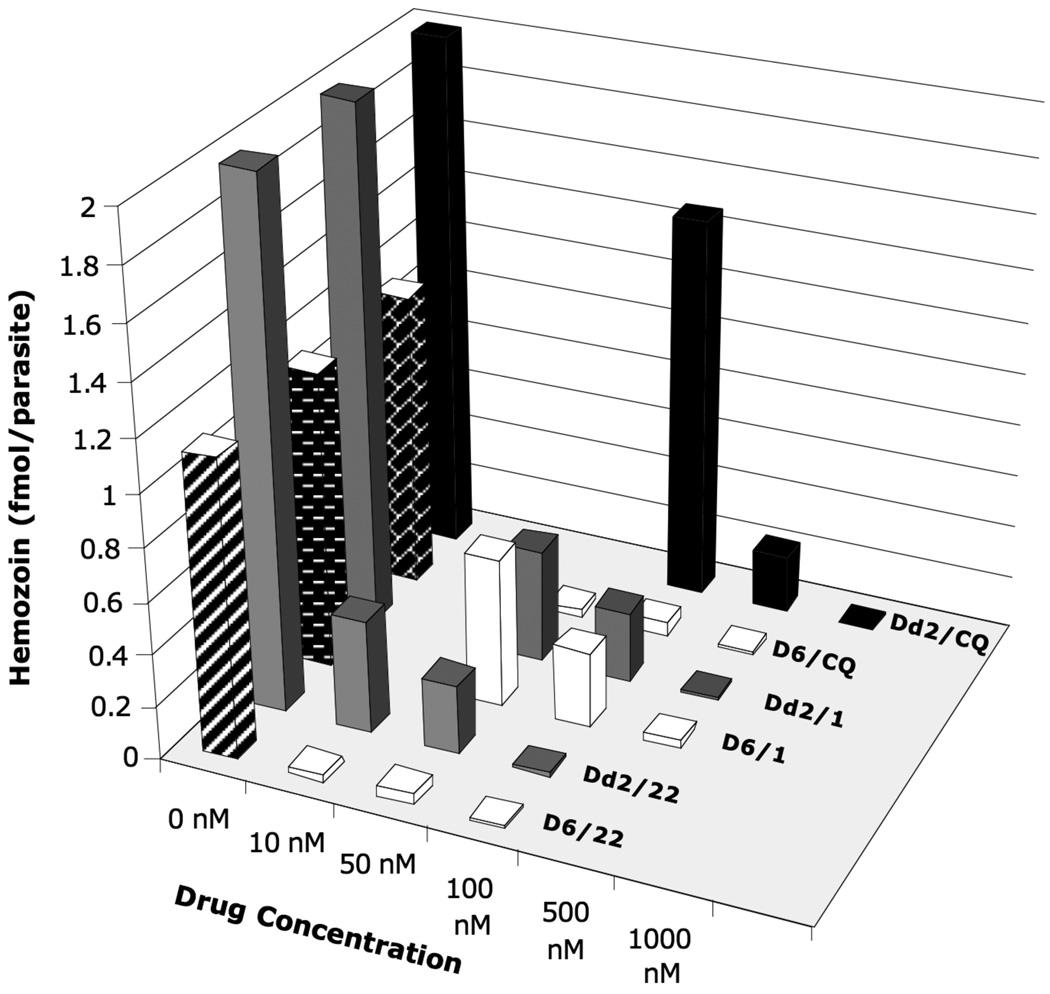
Figure 4.
Graph of hemozoin production in synchronized D6 and Dd2 P. falciparum, when incubated with various concentrations of CQ, 1 and 22. After the parasites were lysed, the hemozoin was collected by centrifugation, washed and dissolved in 0.2 N sodium hydroxide solution. The absorbance at 400 nm was measured, and the amount of heme was calculated using an extinction coefficient of 91,000 cm−1M−1 The amount of heme per parasitized erythrocyte was calculated based on the number of erythrocytes in the culture and the percent parasitemia obtained after growing synchronized culture for 24 hours. Blank regions represent concentration of drug not tested for a particular cell line. Uncertainties are estimated to be at least ±15%, based on estimated uncertainties due to the extraction of hemozoin from the cells.

