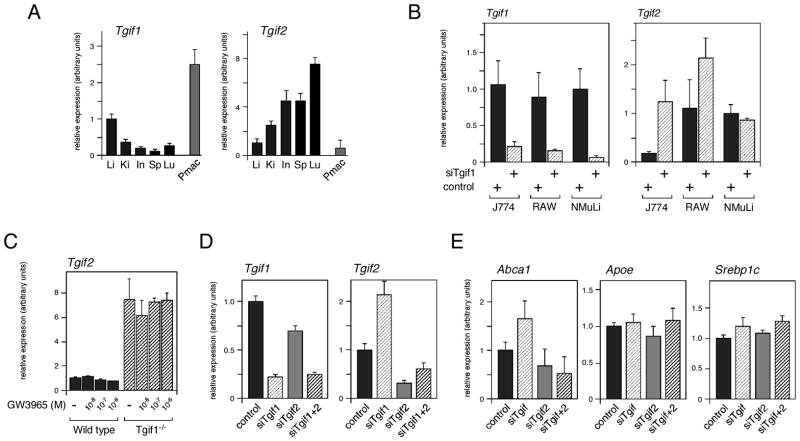
Fig. 4.
Tgif1 and Tgif2 expression levels. A: Tgif1 and Tgif2 expression in a panel of mouse tissues, and peripheral macrophages, was analyzed by qRT-PCR. Li: liver, Ki: kidney, In: intestine, Sp: spleen, Lu: lung, Pmac: peripheral macrophages. B: Expression of Tgif1 and Tgif2 was assayed by qRT-PCR in J774 and RAW macrophage cell lines with Tgif1 knock-down. NMuLi cells are shown for comparison. Fold change in expression relative to the control (set equal to 1) is shown above. C: Peripheral macrophages were isolated from wild type and Tgif1 null mice and incubated with GW3865 (10−8, 10−7, 10−6 M) as indicated. Tgif2 expression was analyzed by qRT-PCR. D: Both Tgif1 and Tgif2 were knocked down in RAW cells (as indicated), and expression was measured by qRT-PCR. E: Expression of Abca1 and Abcg1 was analyzed by qRT-PCR in RAW cells transfected with the indicated siRNAs.

