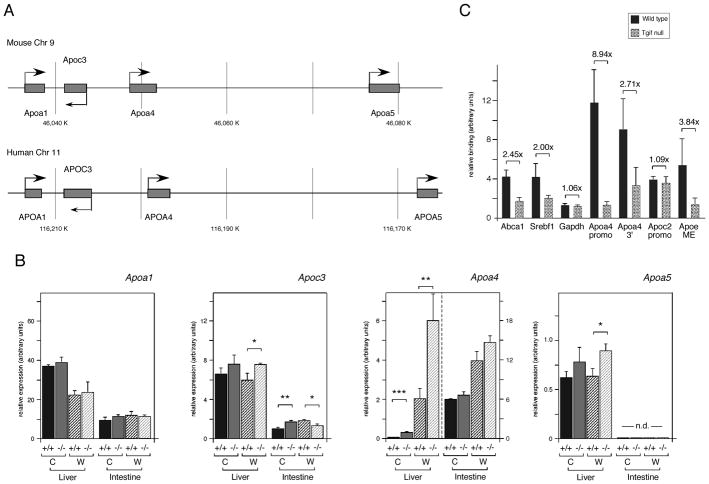
Fig. 6.
Tgif1 represses Apoa4 expression in liver. A: The conserved Apoa4 containing gene clusters from mouse and human are shown schematically. B: Expression of the four genes of the Apoa4-containing gene cluster was analyzed by qRT-PCR, from Liver and intestine from 3 wild type and 3 Tgif1 null mice on a regular chow [C] or mock western [W] diet. Data is shown as the mean expression (+ s.e.m.), determined by the ΔCt method. Significant differences, as determined by the student’s T test, are indicated for comparison between genotypes on the same diet. The significance levels are: * <0.1, ** <0.05., *** <0.01. C: Tgif1 recruitment to LXR target genes in whole mouse liver was analyzed by ChIP. Liver from wild type and Tgif1 null mice was dissociated, chromatin cross-linked, immunoprecipitated with a Tgif anti-serum or the pre-immune and analyzed by q-PCR. Relative binding, normalized to input and pre-immune is shown. The DR4 containing regions of the Abca1, Srebf1 and Apoa4 promoters were analyzed, as well as a region from 3′ of the Apoa4 gene, which also contains a DR4 element. The Apoc2 promoter and the macrophage enhancer (ME) from the Apoe/c cluster were also tested for Tgif recruitment. The Gapdh promoter was tested as a negative control. The fold difference between wild type and null is shown above each.

