
Fig. 3. GIT1 deficiency impairs osteoclast function.
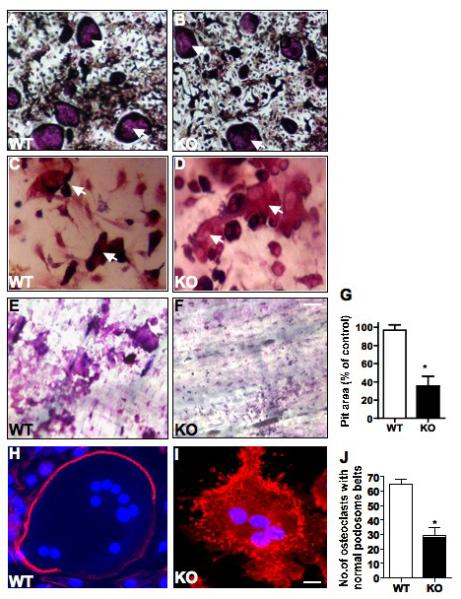
GIT1 WT and KO BM cells were differentiated into OC for 7 days on (A,B) culture dish and (C,D) dentin slices. Cells were fixed, TRAP stained and TRAP positive cells greater than 3 nuclei (arrows) were quantified using a light microscope (WT= 80±10, KO=75 ±12, p>0.05). (E, F) Resorbtion pits on dentine slices were examined by toludiene stain after removing OCs. (G) Quantitative analysis of the pit area volume as percentage of control showed a 65% decrease in GIT1 KO OC. (H, I) GIT1 WT and KO OC were fixed on day 7 and stained for F-actin rings using rhodamine phalloidin. In WT OC, F-actin (red) was organized in podosome belts (H) while GIT1 KO OC showed loss of podosome belts (I). Nuclei (blue) were stained with DAPI to identify multinucleated cells. (Scale bar: 15 μm) (J) Quantitative analysis of number of normal podosome belts in GIT1 WT and KO OC showed a 60% decrease in GIT1 KO OC. A total of 70 OC were counted from three individual experiments. All values are expressed as mean ± SEM. (n=3). Data analysis was done by two-tailed unpaired student’s t-test. A p<0.05 was considered statistically significant.