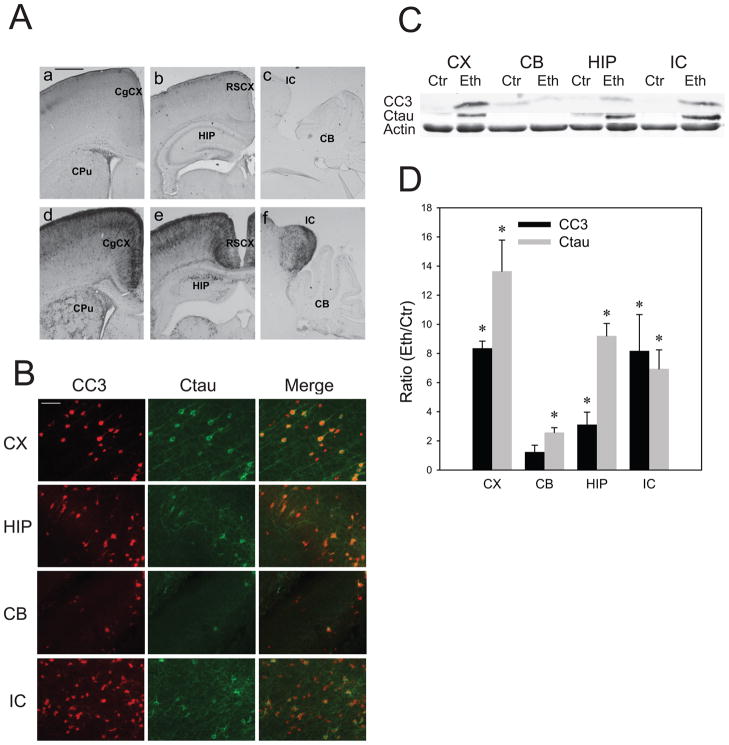
Fig. 1. Brain regional differences in ethanol-induced caspase-3 activation in the P7 mouse brain.
A: Brain coronal (a, b, d, e) and sagittal (c, f) sections of mice sacrificed 8 h after saline (a, b, c) or ethanol (d, e, f) injections were immunostained by the anti-cleaved caspase-3 antibody.CgCX, cingulate cortex; CPu, caudate putamen; RSCX, retrosplenial cortex; HP, hippocampus; IC, inferior colliculus; CB, cerebellum. The bar indicates 500 μm. B: Brain coronal sections (the cingulate cortex region) of mice sacrificed 8 h after ethanol injections were dual-immunofluorescence labeled by anti-CC3 and anti-Ctau antibodies. CX, cortex; HIP, hippocampus; CB, cerebellum; IC, inferior colliculus. The bar indicates 500 μm. C: Immunoblots of the cortex (CX), cerebellum (CB), hippocampus (HIP), and inferior colliculs (IC) samples from mice sacrificed 8 h after saline (Ctr) or ethanol (Eth) injections were probed by anti-CC3, anti-Ctau, and anti-β actin antibodies. D: Quantitative analyses of CC3 and Ctau expression were performed using immunoblots, such as the one shown in C. Data (mean ± SEM, n=4) are expressed as ratios of protein band intensities in the ethanol (Eth) group to those in the control (Ctr) group after normalization to β-actin. *Significantly (P< 0.05) different between the ethanol and control groups by Student’s t-test.

