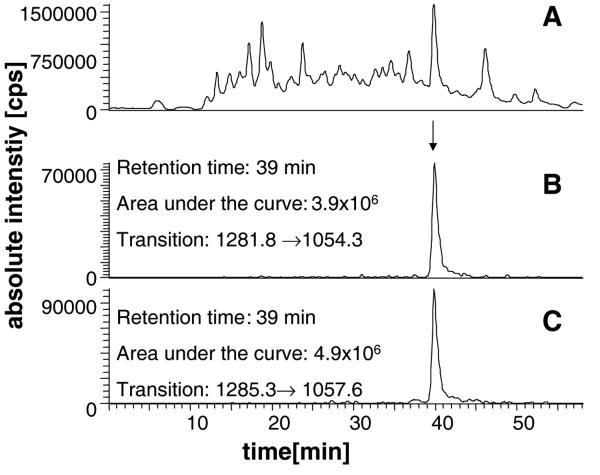
Figure 4.
(A) The total ion chromatogram of an in-gel digest of human liver microsomes. (B) The reconstructed ion chromatogram for the transition m/z 1281.8→1054.3 corresponding to [M+2H]2+ y182+ for the native tryptic peptide GTVVVPTLDSVLYDNQEFPDPEK unique to CYP2E1. (C) The reconstructed ion chromatogram for the transition m/z 1285.3→1057.6 corresponding to [M+2H]2+
 y182+ for the stable-isotope labelled peptide GTVVVPTL*DSVLYDNQEFPDPEK, where L* corresponds to leucine labelled with 13C615N. The ratio of areas under the curves for peaks eluting with retention time ~40 min in (B) and (C) gives a peptide ratio of 0.80 (B/C)which translates to a CYP2E1 concentration of 3.18 pmol/25 μg (127 pmol/mg) microsomal protein. Data acquired on the LCQduo.

