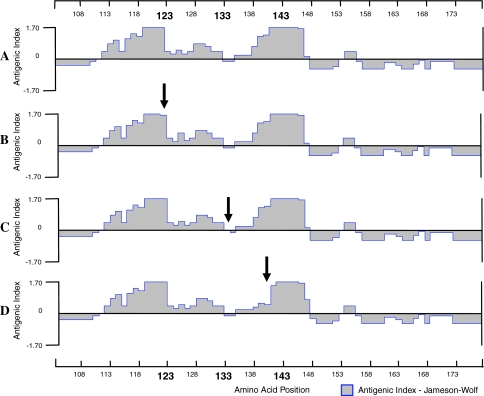
Fig. 2.
Antigenicity plots based on amino acid sequences of the ‘a’ determinant region of HBsAg. Antigenicity plots of the reference sequence (M54923) (a) and of HBV mutants isolated from blood donors found in this study, with amino acid changes T123A (b), M133L (c), and T143M (d). The change in each antigenic index is indicated by an arrow, with the most significant alteration observed in the T143M substitution, while T123A and M133L show minor antigenicity changes

