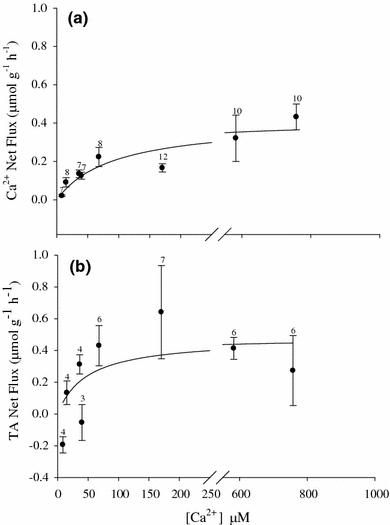
Fig. 7.

Mean net Ca2+ (a) and titratable alkalinity (b) fluxes (μmol g−1 h−1 ± SEM) as a function of ambient [Ca2+] for egg masses of the pond snail L. stagnalis. Values are for day 7 egg masses that were fluxed for 24 h. Regression line is a Michaelis–Menten curve (Net Ca2+: k m = 91 ± 41.5 μmol l−1 Ca2+, V max = 0.4 ± 0.06 μmol g−1 h−1, R 2 = 0.84, P < 0.002). There was no significant relationship between [Ca2+] and TA net flux (P > 0.05); however the curve is the best fit trace assuming Michaelis–Menten saturation kinetics. Sample size is indicated for respective [Ca2+] above each data point
