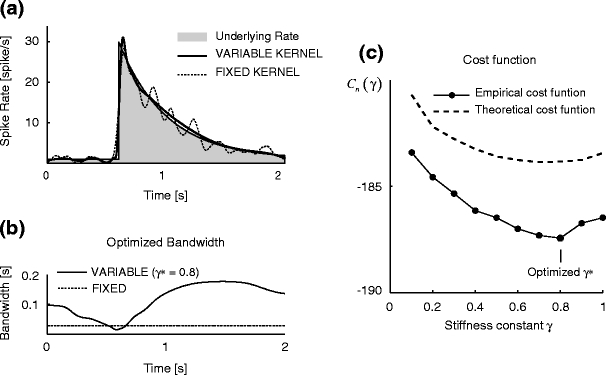
Fig. 2.

Variable kernel density estimation. (a) Kernel rate estimates. The solid and dashed lines are rate estimates made by the variable and fixed kernel methods for the spike data of Fig. 1(b). The gray area is the underlying rate. (b) Optimized bandwidths. The solid line is the variable bandwidth determined with the optimized stiffness constant γ ∗ = 0.8, selected by Algorithm 2; the dashed line is the fixed bandwidth selected by Algorithm 1. (b) The cost function for bandwidth stiffness constant. The solid line is the cost function for the bandwidth stiffness constant γ, Eq. (18), estimated from the spike data; the dashed line is the cost function computed from the known underlying rate
