
Fig. 2.
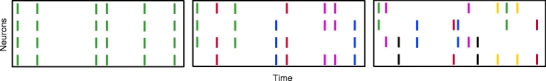
Strong pairwise correlations imply higher-order correlations. Raster plots show populations that have a single event amplitude that differs in the three panels (left: all events have amplitude 4, middle: amplitude 3, right: amplitude 2). Note that an increase in pairwise correlations in the right population can only be achieved by increasing the event amplitude and thereby the order of correlation. The plots thus illustrate the populations that are maximally correlated with correlations of order ≤ 4 (left), ≤ 3 (middle) and ≤ 2 (right)