
Fig. 6.
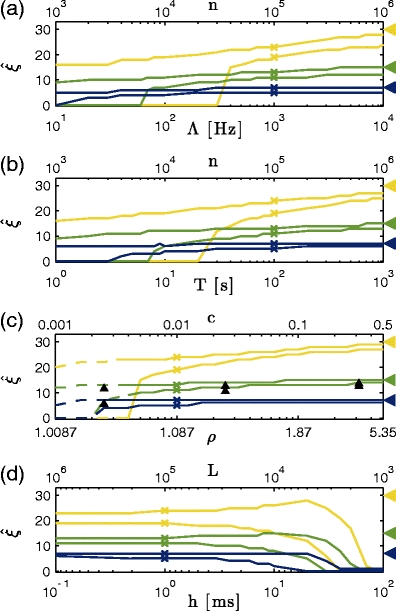
Parameter dependence of CuBIC for m = 3. Shown are the percentiles ξ
05 and ξ
95 (lower and upper curves of same color, respectively; see Fig. 5(b)), as a function of (a) the population firing rate Λ, (b) the duration of the experiment T, (c) the correlation strength ρ, and (d) the bin width h for data sets with correlation of maximal order ξ
syn = 7 (dark blue), ξ
syn = 15 (green) and ξ
syn = 30 (yellow). Crosses denote default parameter combinations (Λ = 103 Hz, T = 100 s, ρ = 1.087 and h = 1 ms) one of which is varied in the different panels. Additional x axes show corresponding values of the total spike count n = ΛT (a and b), the pairwise correlation coefficient c assuming a population of N = 100 neurons, N
C = 30 of which are homogeneously correlated (c), and the sample size  (d). Arrowheads on the right indicate ξ
syn, which is the optimal value for ξ
95. Data points for the dashed lines in (c) contain data sets were k
2 did not significantly exceed k
1 (compare Section 4.2.2). Upward arrowheads in (c) denote the percentiles for the parameter combinations of Fig. 5(b)
(d). Arrowheads on the right indicate ξ
syn, which is the optimal value for ξ
95. Data points for the dashed lines in (c) contain data sets were k
2 did not significantly exceed k
1 (compare Section 4.2.2). Upward arrowheads in (c) denote the percentiles for the parameter combinations of Fig. 5(b)