
Fig. 3.
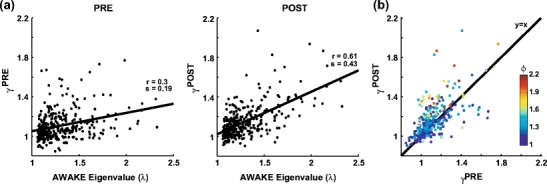
Eigenvectors from AWAKE better match activity in sleep POST than in PRE. (a) Eigenvalues from the AWAKE correlation matrix (x-axis) plotted against the average reactivation strength represented by the very same vectors during sleep PRE (left) and POST (right) for signal components only ( ). Each dot represents one of the 323 signal components identified from 63 datasets (four rats). Correlation values (r) and slopes (s) are indicated for the two distributions. The two measures were more strongly correlated during POST, and the slope of the linear regression line was steeper too (p < 10 − 6). (b) Average reactivation strength from POST versus PRE. Encoding strength is color coded. The points tend to lie above the line representing the identity function, showing that mean reactivation was stronger during POST. This effect was stronger for components with higher encoding strength