
Fig. 4.
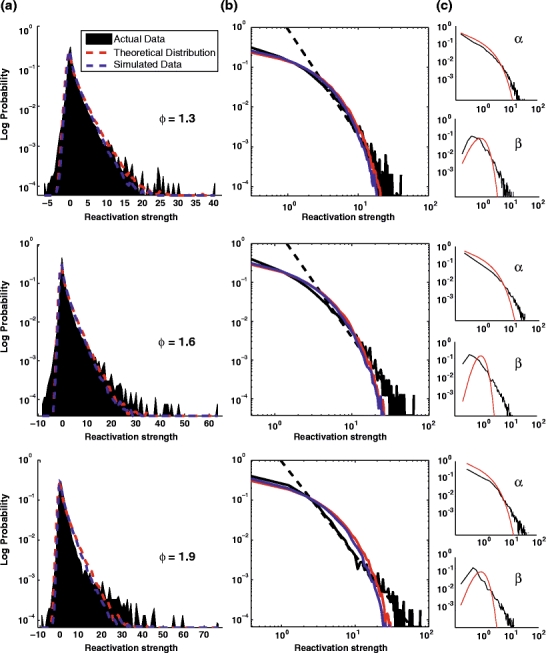
Distribution of the R measure during the TEMPLATE epochs (R
TE − TE). Data are from the same three sessions as in Fig. 1 (AWAKE). (a) Distribution of R across all time bins for the first principal component of each of the three sessions (representative of the dataset, the respective encoding strength  are displayed on top of the distributions). Real data (black), theoretical expectation (red) derived from a Monte-Carlo sampling of Eq. (32) (n = 105), and a numerical simulation using normal multivariate data with the same correlation matrix as the actual data (blue). (b) Same plots as A but in log-log scale. (c) Distribution of the α and β terms from Eq. (32). High encoding strength eigenvectors (e.g. one at bottom) tend to exhibit a clear power-law distribution of their R measure distribution