
Fig. 7.
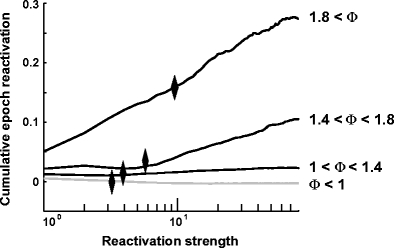
Cumulative average computed with Eq. (34) for components of the whole data sets separated in the same four groups as in Fig. 6. Black diamonds display the 99th percentile of the POST distribution. This shows that for the highest encoding strength, half of the difference between PRE and POST (represented by the asymptotic value of each curve) is explained by only 1% of the bins of POST sleep