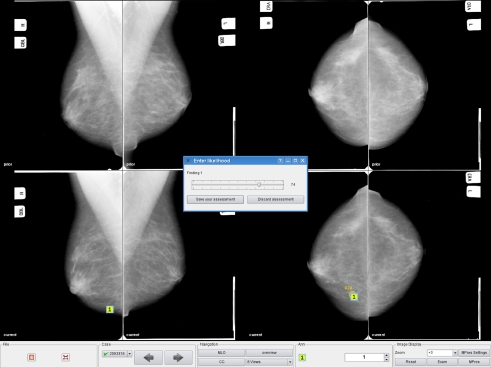
Fig. 1.
The graphical user interface of the CAD workstation used in the observer experiments. The upper row shows prior mammograms and the lower row displays the current screening mammograms that have to be reported. In the case shown here, a reader reported a localized finding in both projections and is asked to assign a malignancy score between 0 and 100 to that finding. In the craniocaudal (CC) view, a CAD region was present at the reported location

