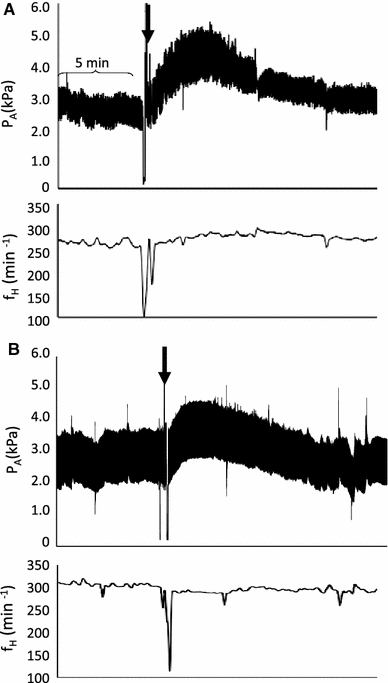
Fig. 1.

Representative traces from two different 21-day-old embryonic chickens. These traces illustrate the arterial pressure (P A) and heart rate (f H) response to an injection of a Ang II (1,000 ng/kg) alone, and b after pretreatment with [Sar1 ile8] Ang II (4,000 ng/kg). For each trace, the arrow indicates the point of Ang II (1,000 ng/kg) injection. The bracket indicates a period of 5 min
