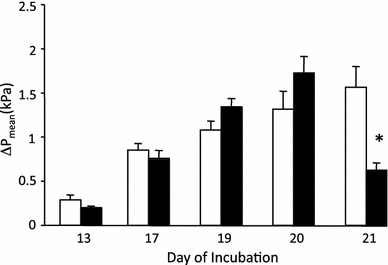
Fig. 3.

The peak change in P mean following an injection of Ang II 1,000 ng/kg when given as a single injection (open bar), or in a separate group following pre-injection with [Sar1 ile8] Ang II 4,000 ng/kg (filled bar). An asterisk indicates a significant (p < 0.05) difference in the pressure response between the two injections on a given day of incubation. The data are presented as mean ± SE
