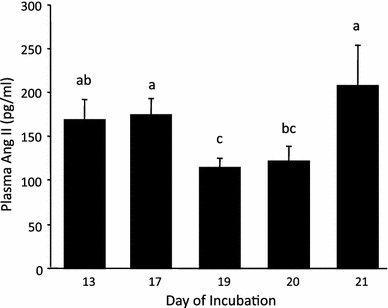
Fig. 4.

The control plasma Ang II concentrations in embryonic chickens during the period of development studied. Different letters between any two incubation age groups indicates a significant (p < 0.05) difference in the plasma Ang II concentration between the groups. The data are presented as mean ± SE
