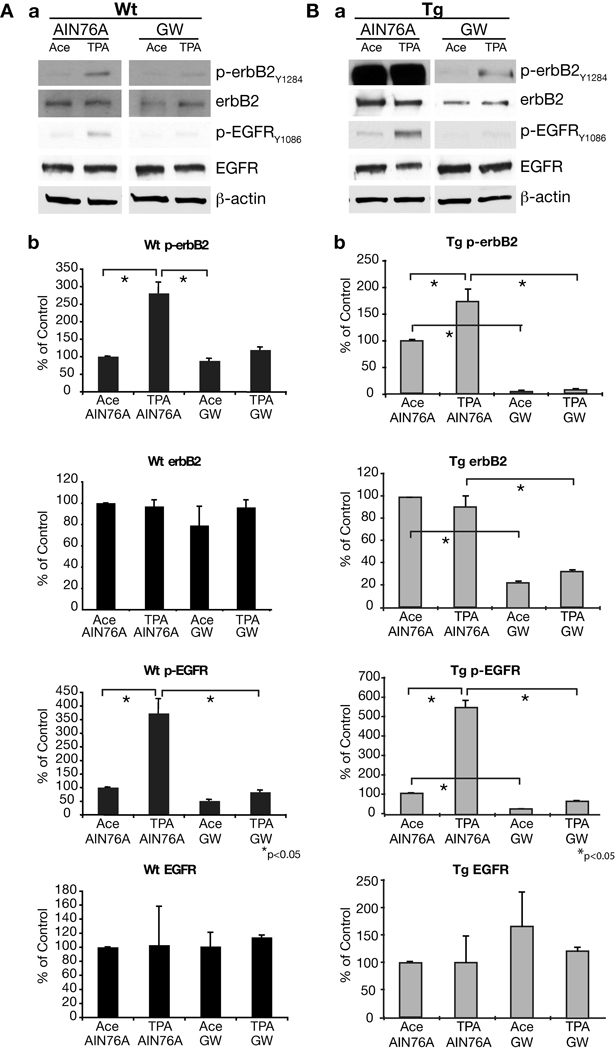
Figure 6.
Western blot analysis of the levels of total and phosphorylated erbB2 and EGFR in the dorsal skin. (A) Skin from wild-type mice fed with AIN76A or GW2974. (B) Skin from BK5.erbB2 mice fed with AIN76A or GW2974 diet. A group of four mice received four topical applications (given twice-weekly) of either 6.8 nmol TPA or acetone over 2 weeks and were sacrificed 4 h after the last treatment. Mice were fed with either AIN76A control diet or GW2974 containing diet from 2 weeks prior to the first TPA or acetone treatment until the end of the experiment. (a) Representative Western blots. (b) Relative expression levels measured via densitometry normalized to β-actin levels. Note that the Western blot of p-erbB2, erbB2 and p-EGFR from wild-type mice needed significantly longer exposure time to develop the film compared to erbB2 mice. *p <0.05

