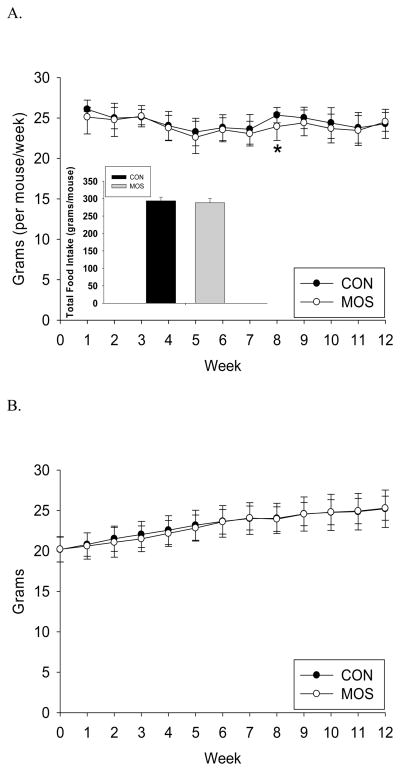
Figure 1.
Food intake and body weight. A) Weekly food intake (grams/mouse) by group (CON: n=24; MOS: n=24) during the 12 week study with inset showing total food intake (grams/mouse) by group (mean±s.d.). B) Body weight (grams/mouse) by group (CON: n=24; MOS: n=24) during the 12 week study. * denotes significance at p<0.01.

