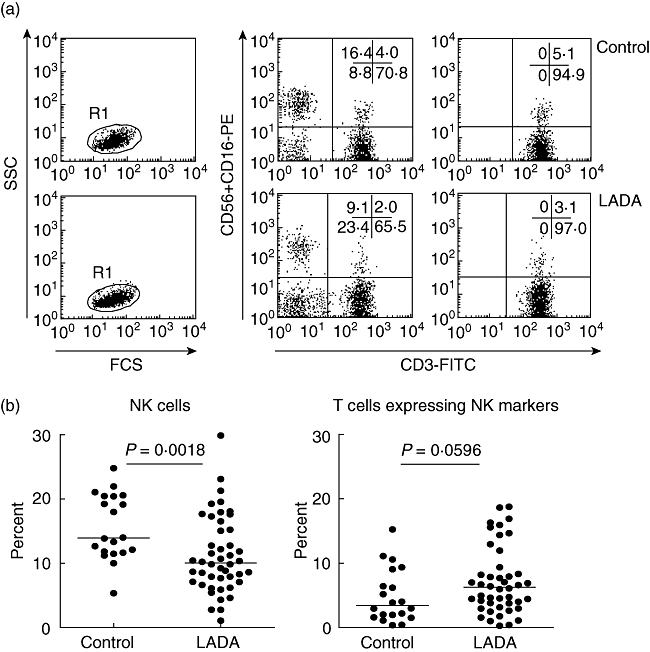
Fig. 1.

Flow cytometry analysis of natural killer (NK) cells in whole blood. Representative dot plots showing analysis of blood NK cells from the lymphocyte fraction using CD3 and CD16+CD56 as markers (a). The frequency of CD3−CD16+CD56+ NK cells and CD3+ CD16+CD56+ T cells was investigated in blood from latent autoimmune diabetes in adults (LADA) (n = 46) and healthy control individuals (n = 20) (b). Each dot represents a different individual and median values for each group is marked with a horizontal line. Using the Mann–Whitney non-parametric test a significant difference in NK cell frequency was noted between LADA patients and healthy controls (P = 0·0018).
