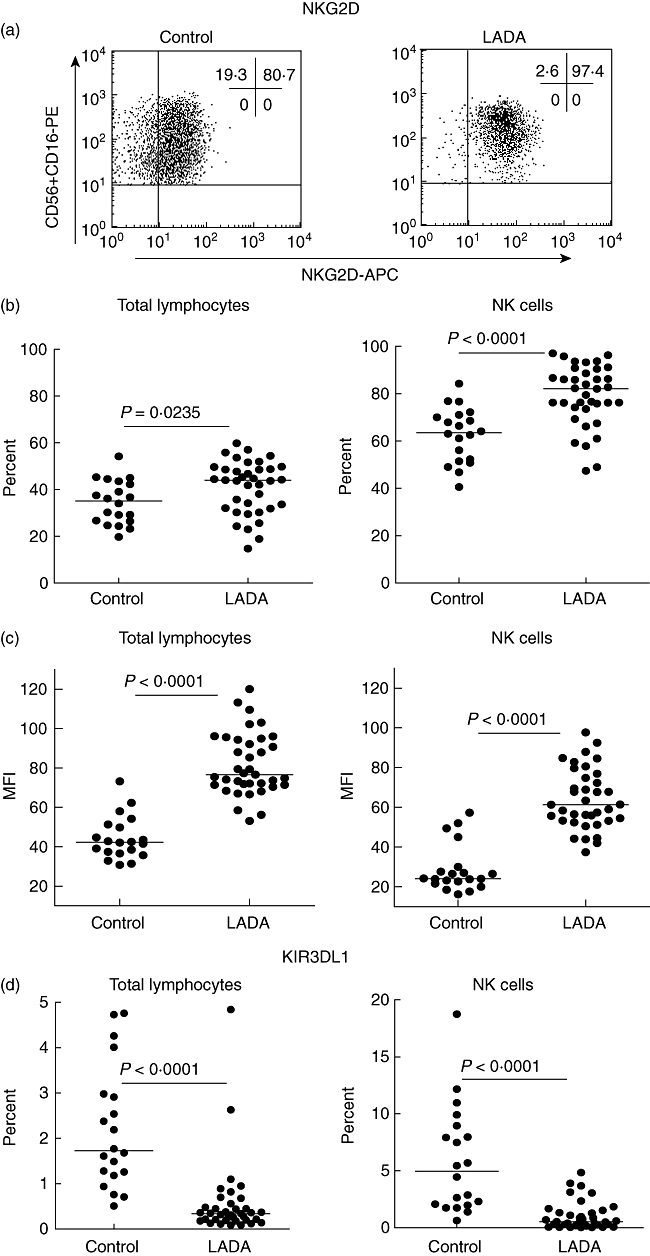
Fig. 2.

Activating status of lymphocytes and natural killer (NK) cells. (a) Representative dot plots showing NKG2D expression of blood NK cells from the lymphocyte fraction using CD3 and CD16+CD56 as markers in control and latent autoimmune diabetes in adults (LADA) patients. The activating status of blood lymphocytes, especially NK cells, was determined using the expression of the surface markers NKG2D (b,c) and KIR3DL1 (d) from LADA (n = 37) and control (n = 20) individuals from which frozen peripheral blood mononuclear cells (PBMCs) were saved from the first visit. Each dot represents a different individual and the median values for each group is marked with a horizontal line. (b) Using the Mann–Whitney non-parametric test a significant difference in percentage of NKG2D expression was noted between LADA patients and healthy controls both in the total lymphocyte population (b, left panel) (P = 0·0235) and the NK cell population (b, right panel) (P < 0·0001). (c) A significant increase of NKG2D expression at single cell level was observed in LADA patients using the mean fluorescence intensity (MFI) both in the total lymphocyte population (c, left panel) (P < 0·0001) and the NK cell population (c, right panel) (P < 0·0001). (d) A significant difference in percentage of KIR3DL1 expression was also noted between LADA patients and healthy controls in the total lymphocyte population (d, left panel) (P < 0·0001) and the NK cell population (d, right panel) (P < 0·0001).
