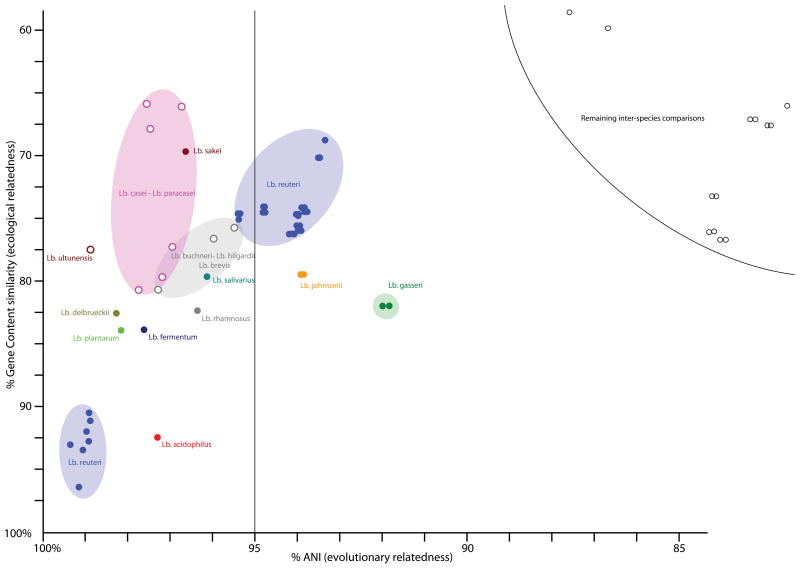
Figure 3. Inter-strain diversity among Lactobacillus genomes.
Each point represents a whole-genome comparison between two Lactobacillus genomes and shows the percentage average nucleotide identity (ANI) on the x-axis as a measure of evolutionary distance, plotted against the percentage of gene content similarity on the y-axis. Only comparisons with ANI values above 85% are shown. The vertical line at 95% corresponds to a recommended cut-off of 70% DNA–DNA reassociation for species delineation. Different intra- and inter-species comparisons are color-coded, with full or open circles respectively, and labeled with given taxonomical name in corresponding color. Colored ovals assist in identifying related data points belonging to a single named species.

