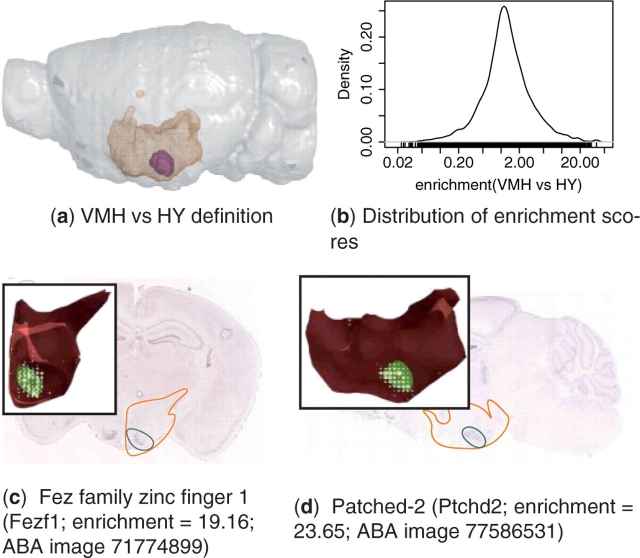
Fig. 2.
ALLENMINER identified genes enriched in the VMH. (a) The VMH (purple) is shown in the context of the HY (orange mesh) in the left hemisphere (grey) (figure produced by PyMol, http://pymol.org). (b) Distribution of VMH versus HY enrichment score (Equation 2). In situ images, the 3D registered expression in the HY (inset), and ALLENMINER enrichment scores are shown for two genes that are VMH enriched: (c) Fezf1 and (d) Ptchd2. The positions of the HY (orange outline) and VMH (blue outline) are depicted on the in situ images. The 3D registered expression (inset, yellow circles) in the HY (red) is shown along with the highlighted VMH nuclei (green) (figure produced by BrainExplorer; Lau et al., 2008).

