
Fig. 5.
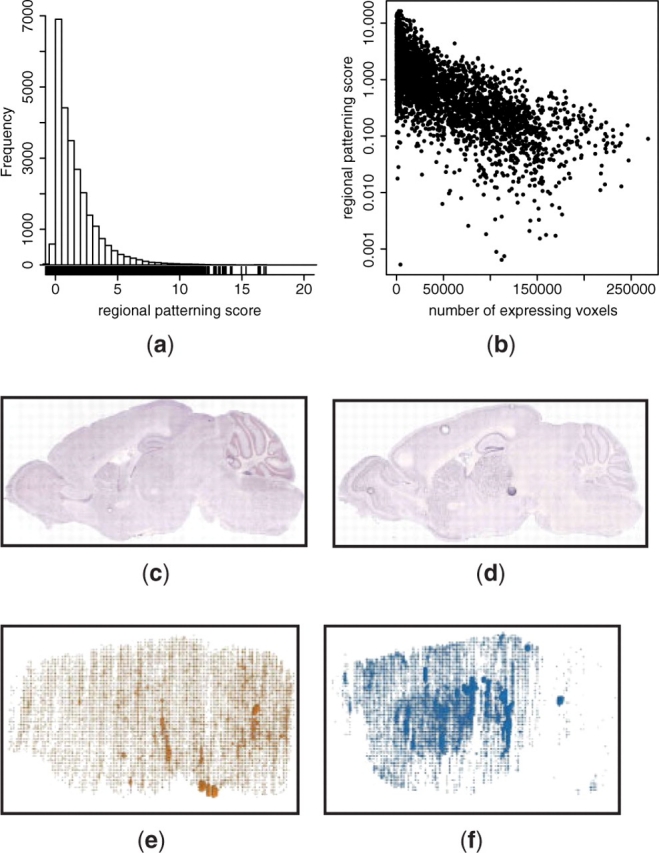
Distribution of gene expression specificity in the mouse brain. (a) Distribution of RPS (Equation 4) of all ABA 3D expression profiles (sagittal and coronal). The maximum observed RPS is 39 (data not shown). (b) Comparison of the RPS to the number of voxels with detectable expression in the coronal subset of ABA 3D expression profiles. (c and e) Regulator of G-protein signaling 5 (Rgs5; 38,501 voxels; RPS=0.14; ABA image 71548305) is distributed across the brain. (d and f) gamma-aminobutryic acid (GABA-A) receptor, subunit alpha 4 (Gabra4; 26,983 voxels; RPS=2.8; ABA image 75251433) is more specifically expressed, with enrichment in the thalamus, caudoputamen and cortex. Although both genes express in a similar number of voxels, they exhibit significant differences in expression specificity.