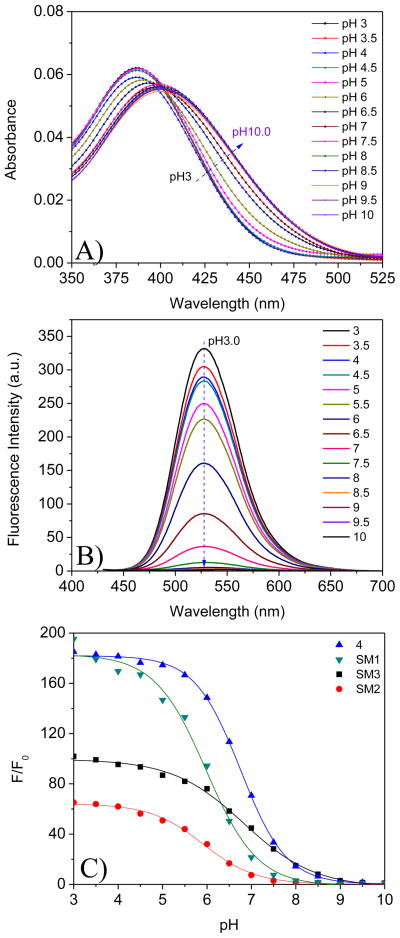
Figure 2.
UV-Vis spectral change (A) and emission change (B) of SM1 in B-R buffer at different pH values. Figure 2C shows fluorescence intensity (at 517 nm) ratios of SM1, SM2, SM3, and 4 from pH 3 to pH 10. F0 is the fluorescence intensity at pH 10. Excitation wavelength for emission spectra was 405 nm. Concentrations of the sensors were 5 μM.

