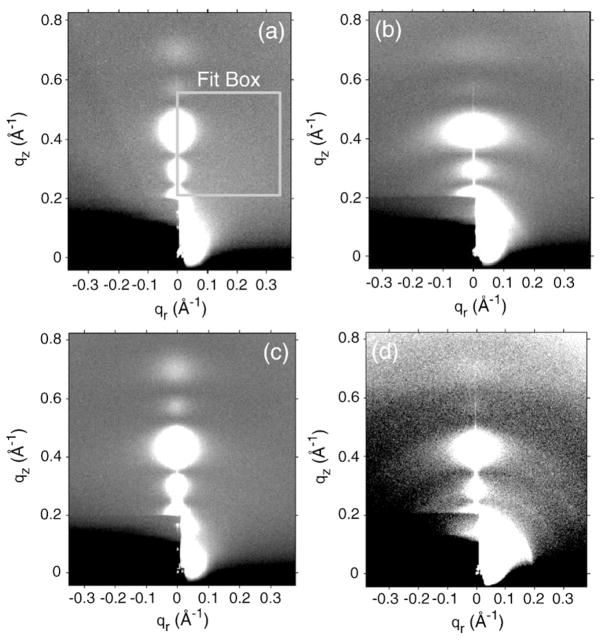
Fig. 1.
CCD images (high intensity is white) of (a) LM3 (D=120 Å), (b) 4.8 mol% FP23/LM3 (D=143.7 Å), (c) 4.8 mol% FPwsm/LM3 (D=74.7 Å), and (d) 1.6 mol% FPtri/LM3 (D=65.4 Å). The beam and first two Bragg orders are visible through the rectangular, molybdenum semitransparent beam stop in the lower left-hand corner. Data were analyzed for KC in fit boxes such as the one shown in (a). Grayscale was optimized for comparison.

