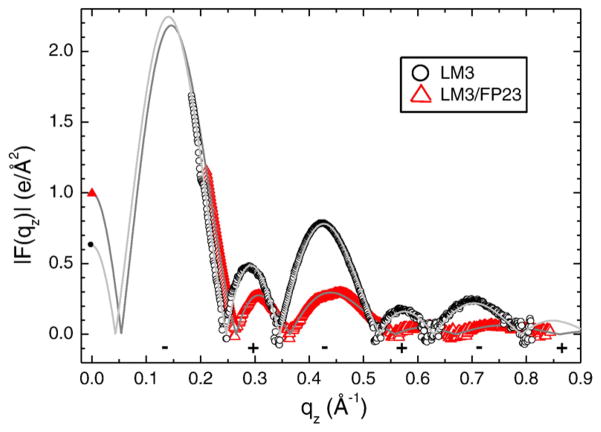
Fig. 2.
Form factor data for LM3 and 4.8 mol% FP23/LM3. Open symbols are from LAXS intensity data and continuous lines are best fits to the SDP model. The F(0) points (filled symbols) come from volume measurements [Eq. (1)]. Phases (±) are shown beneath the lobes.

