
Fig. 3.
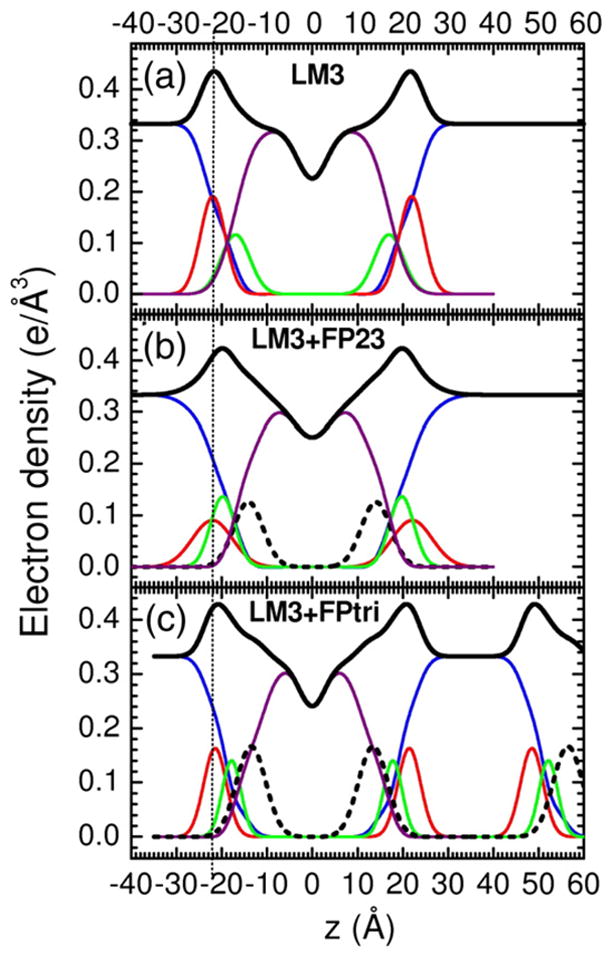
Electron density versus distance from the bilayer center z from samples of (a) LM3, (b) 4.8 mol% FP23/LM3, and (c) 1.6 mol% FPtri/LM3. Line colors: Black is total electron density, blue is water, red is phosphate plus choline or other average headgroup moiety, green is glycerol–carbonyl, purple is hydrocarbon region including cholesterol when present, and black dotted line is peptide. (c) shows part of a second adjacent bilayer at large values of z, and the presence of a large water spacing between adjacent bilayers is emphasized in all panels.