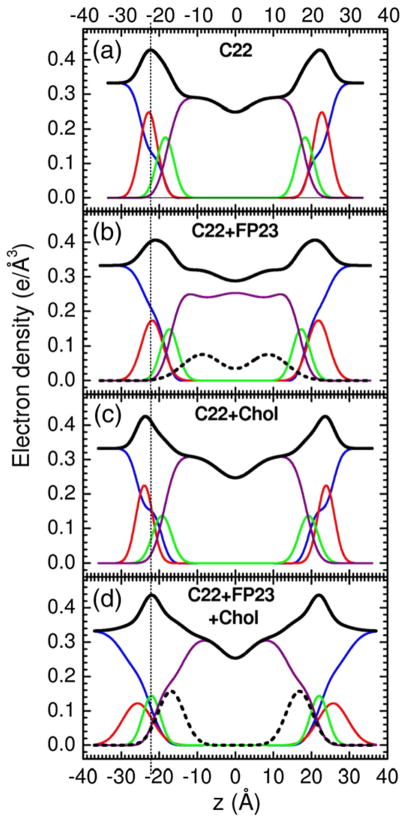
Fig. 4.
Electron density profiles of (a) diC22:1PC, (b) 6.3 mol% FP23/diC22:1PC, (c) 30 mol% cholesterol/diC22:1PC, and (d) 6.3 mol% FP23/diC22:1PC/30 mol% cholesterol. Only one central bilayer is shown with the profiles cut off at ±D/2 and therefore only half the water space between bilayers is shown. Line colors are as in Fig. 3.

