Fig. 7.

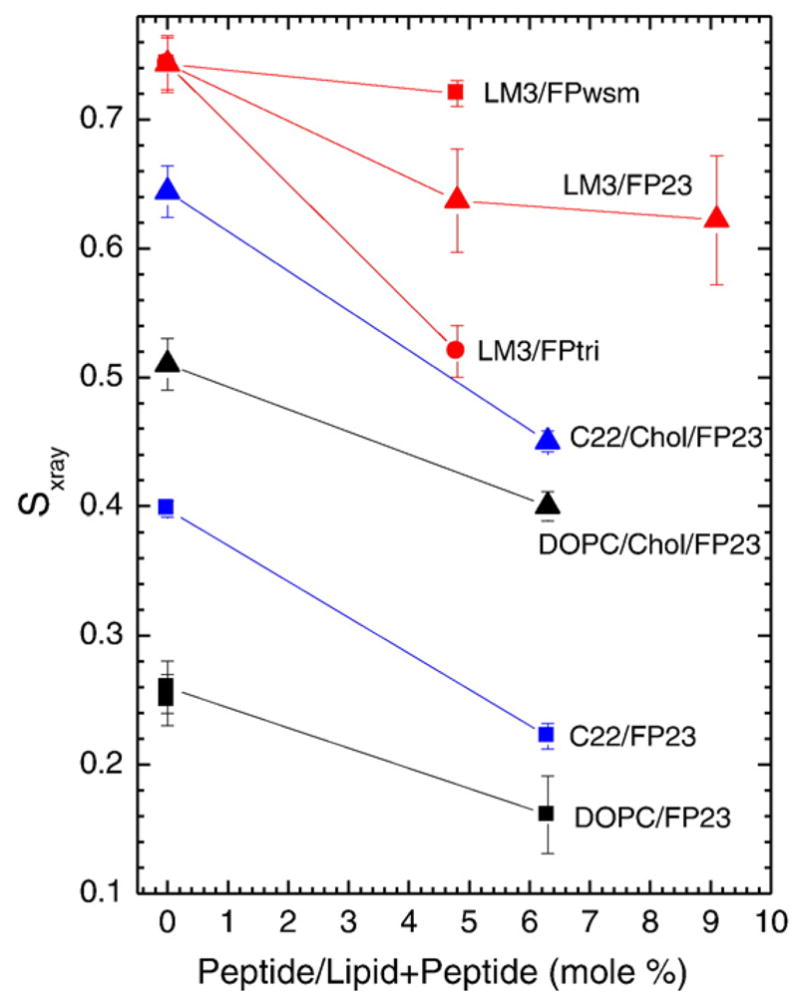
Sxray order parameters as a function of increasing peptide concentration; 1.6 mol% FPtri/LM3 is plotted at the equivalent native amino acid concentration, 4.8 mol% FPtri/LM3, for appropriate comparison. Lines are to guide the eye.

Sxray order parameters as a function of increasing peptide concentration; 1.6 mol% FPtri/LM3 is plotted at the equivalent native amino acid concentration, 4.8 mol% FPtri/LM3, for appropriate comparison. Lines are to guide the eye.