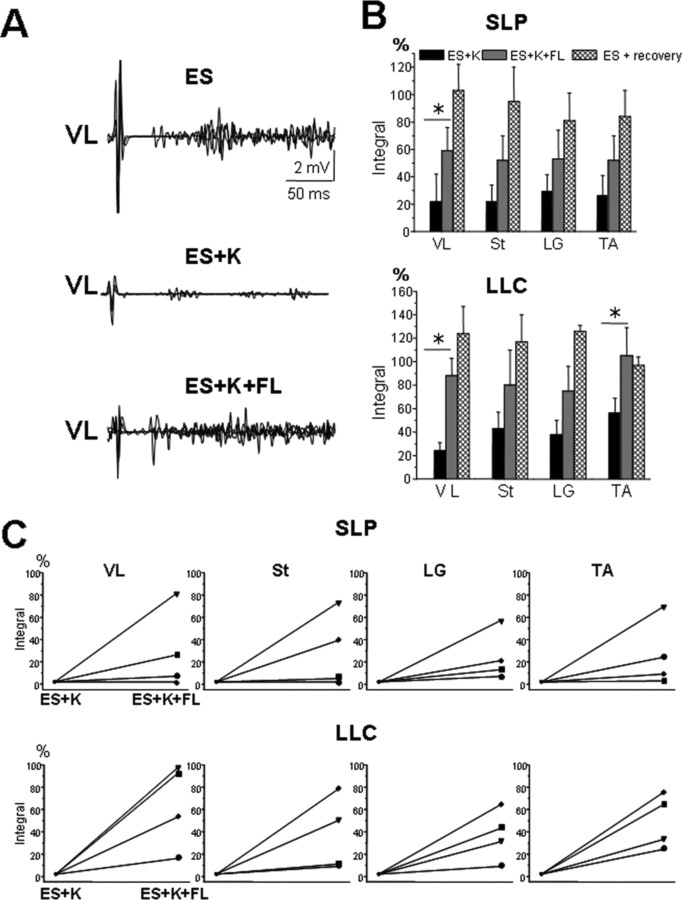
Figure 5.
Superposition of four responses within a single VL EMG burst during ES alone, ES+K, and ES+K+FL are shown in A. The mean integral (expressed as a percentage of pre-K administration) of the SLP and LLC within the VL, St, LG, and TA EMG bursts during stepping with ES+K, ES+K+FL as well as during ES ∼2–2.5 h after K administration (ES recovery) are shown in B. Note the significantly smaller responses under ES+K, the partial recovery with FL movements, and the restoration of the responses to or above pre-K values after recovery. Significant difference between ES+K and ES+K+FL at *p < 0.05. In all cases, ES recovery is significantly different from ES+K. In C, the percentage change in the integral of the SLP and LLC for each of four animals. All data are collected from muscles on the same side. Each symbol represents the same animal for each of the four muscles. Abbreviations, same as in Figures 1 and 2.

