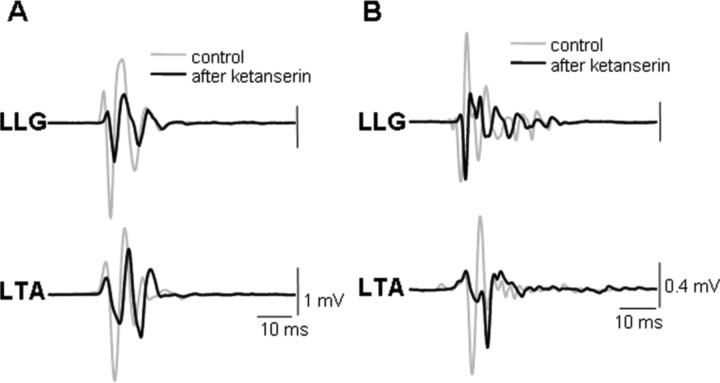
Figure 7.
Averaged (n = 10) SLPs from the LLG and LTA in response to ES (0.3 Hz) during standing in two decerebrated cats (A, B) are shown. The gray traces show the potentials before and the black traces after ketanserin administration. Note the lower (∼50%) amplitudes after rather than before ketanserin administration. Abbreviations, same as in Figures 1 and 2.

