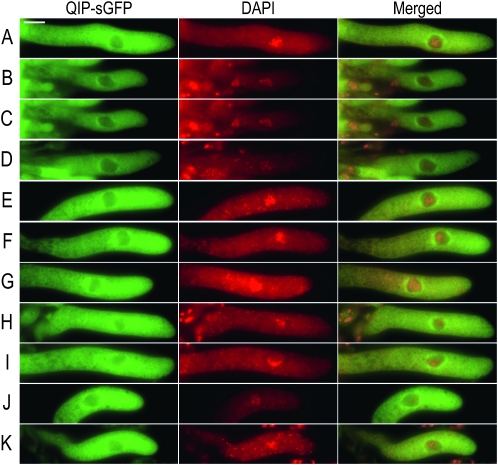
Figure 2.—
Localization of QIP–sGFP in meiosis. Pictures show representative asci photographed at the pachytene stage of meiosis I. Columns 1 and 2 show the QIP–sGFP (green) and DAPI (red) signals, respectively. Column 3 shows the corresponding merged images of columns 1 and 2. Tissues were harvested at 4 days postfertilization and processed as described in materials and methods The bar on A, column 1, equals 20 mm.

