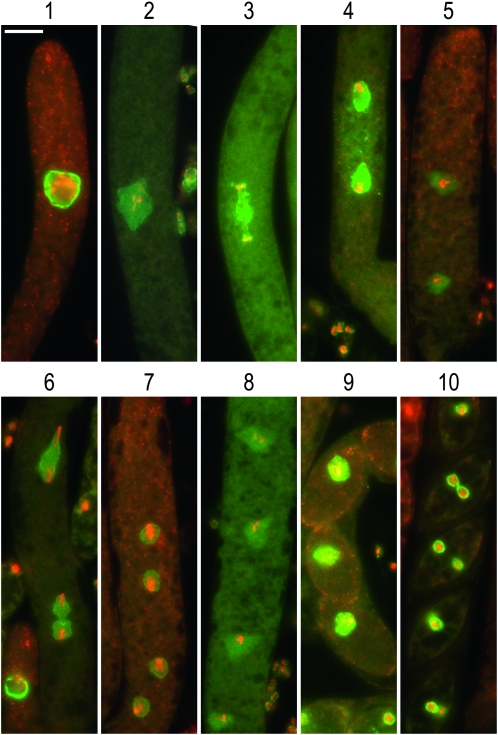
Figure 4.—
Localization of GLE-1–sGFP in normal meiosis. The cellular localization of GLE-1–sGFP was followed during meiosis in a cross between strains (DLNCR553 × DLNCR554; Table 1), representing cells in (1) pachytene, (2) metaphase, (3) telophase, (4) interphase, (5) prophase II, (6) anaphase II through telophase II, (7) early interphase II, (8) late interphase II, (9) metaphase IV, and (10) postmitosis II. Stages were assigned following Raju (1980). All stages show the merge image of GLE-1–sGFP (green) and DAPI (red) signals. Tissues were harvested at 5 and 7 days postfertilization and processed as described in materials and methods. The bar in l 1 equals 20 μm. Pictures were taken at 600×.

