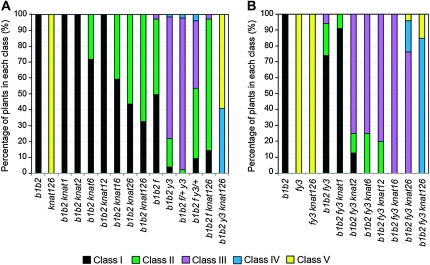
Figure 3.—
Comparision of leaf ectopic outgrowth phenotypes. (A) Graphical representation of the percentage of plants in the bop1 bop2 background displaying rosette and cauline leaf phenotypes of differing severities, grouped from class I (most severe) to class V (least severe). (B) Graphical representation of the percentage of plants in the fil yab3 background displaying rosette and cauline leaf phenotypes of differing severities, grouped from class I (most severe) to class V (least severe). n ≥ 85 plants per genotype.

