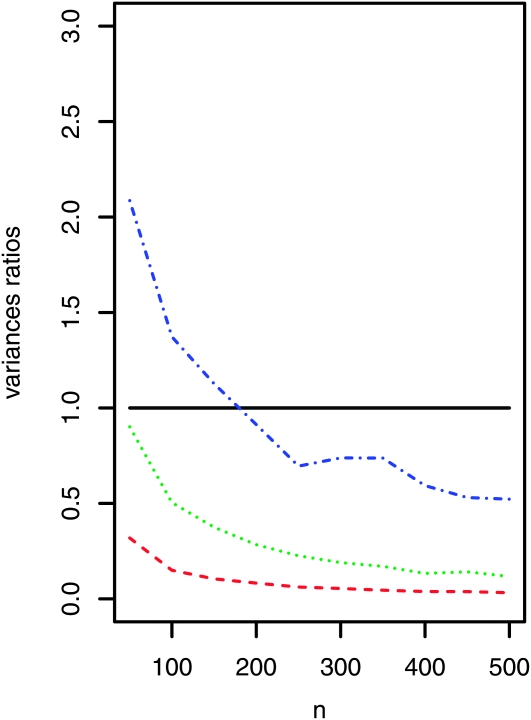
Figure 8.—
Variance ratios (Varpooled/Varstandard) when estimating allele frequencies in the case where the amount of probe material also differs from individual to individual according to log-normal factors. The median factor is always 1, and with a scale of s, ∼32% of all probes deviate by a factor of more than s. For the scale value s = 2 (for instance) 16% of probes involve more than double the median probe amount, and another 16% contain less than one-half the median amount. Ratios <1 indicate that pooling leads to estimates with a smaller variance. Individual sequencing is carried out for 10 individuals with an expected coverage of λ = 10. Scales: s = 2 (red dashed line), s = 4 (green dotted line), s = 8 (blue dashed-dotted line). [Log-normal parameters: μ = 0, σ = log(scale), scale ∈ {2, 4, 8}.]

