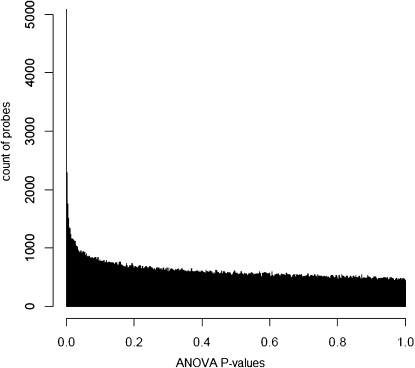
Figure 2.—
Histogram of 3,015,075 probe P-values from nested ANOVA analysis based on mean probe hybridization signal intensities of four geographical locations: the United States, Caribbean, Cameroon (West Africa), and Zimbabwe (see materials and methods for location information). P-values reflect the significance associated with differentiation only between geographical regions (i.e., the geographical region effect in the nested ANOVA design; see text for details).

