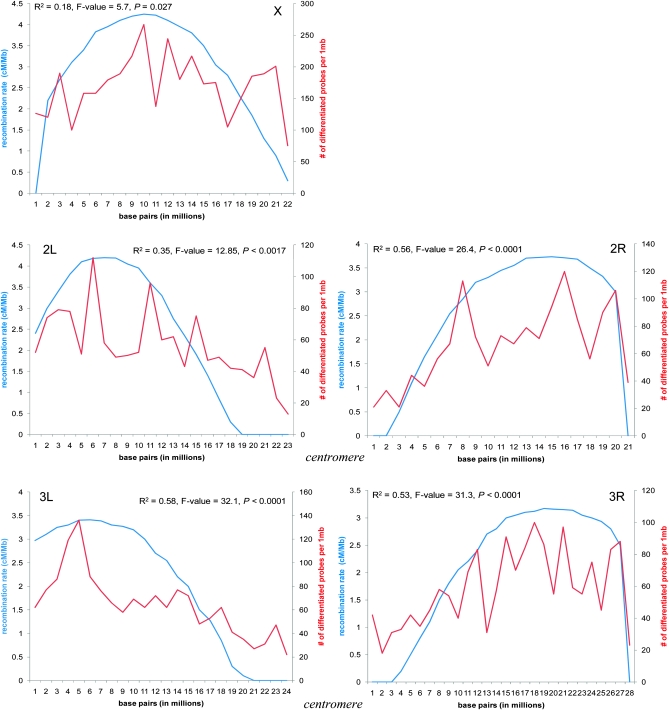
Figure 5.—
Relationship between recombination rate (blue) and the number of differentiated probes (red) from the nested ANOVA for each 1-million-bp window along the chromosome arm. Recombination rate data were acquired from http://petrov.stanford.edu/cgi-bin/recombination-rates_updateR5.pl. and were estimated by plotting Marey maps of the genetic positions of molecular markers (in centimorgans, cM) against their physical position (in megabase pairs, Mb). For this analysis, we used 9286 probes identified at the 5% FDR level from the nested ANOVA. Adjusted regression coefficients and their significance are shown.

