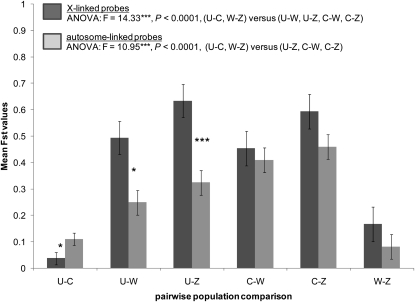
Figure 6.—
Mean FST values (Weir and Cockerham's) among 19 X-linked (solid bars) and 20 autosomal (shaded bars) sequenced probes between six pairwise geographical comparisons: United States–Caribbean (U-C), United States–West Africa Cameroon (U-W), United States–Zimbabwe (U-Z), Caribbean–West Africa Cameroon (C-W), Caribbean–Zimbabwe (C-Z), and West Africa Cameroon–Zimbabwe (W-Z). ANOVAs describe significant differentiation between geographical comparisons for both X and autosomal probes. Asterisks designate significant differentiation (t-test) between X and autosomal probes for each geographical comparison (*P < 0.05, ***P < 0.0001).

