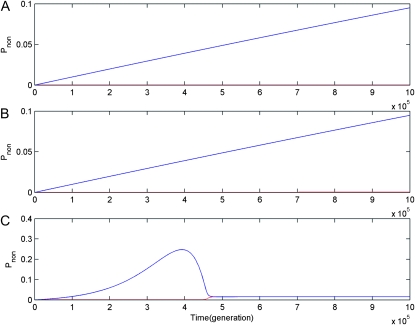
Figure 5.—
Dynamic changes of the probabilities of nonfunctionalization at the ancestor (Pnon1) and newly duplicated (Pnon2) loci in infinite haploid vs. diploid populations under free recombination (r = 0.5) and μ = 10−5. Numerical results in subplot A, B, and C are obtained under the DNR selective model in a haploid population, under the DNR selective model in a diploid population, and under the HI selective model in a diploid population, respectively. Red and blue curves are of Pnon1 and Pnon2, respectively.

