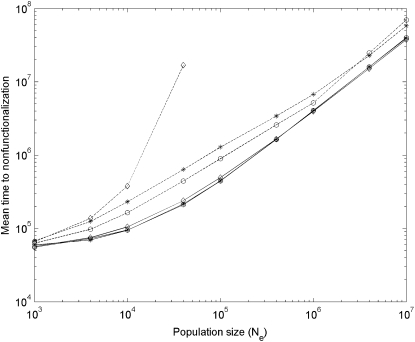
Figure 6.—
Simulation results of mean time to nonfunctionalization after segmental gene duplication in haploid vs. diploid populations with μ = 10−5. Solid and dashed curves are results for linked (r = 0) and unlinked (r = 0.5) gene duplication, respectively; asterisks, circles, and diamonds are results under the DNR selective model in haploid populations, under the DNR selective model in diploid populations, and under the HI selective model in diploid populations, respectively. When N > 40000 (or Nμ > 0.4), nonfunctionalization for unlinked gene duplication is difficult to reach under the HI selective model. Simulation repeats 2000 times.

